Atmospheric chemistry modeling
We use both global and regional CTMs in our research. GEOS-Chem v10.1 global run and NA/Asia nested runs are configured to run on RSPH's linux computing cluster. We have used CMAQ and WRF-Chem simulations extensively in many areas of our research.
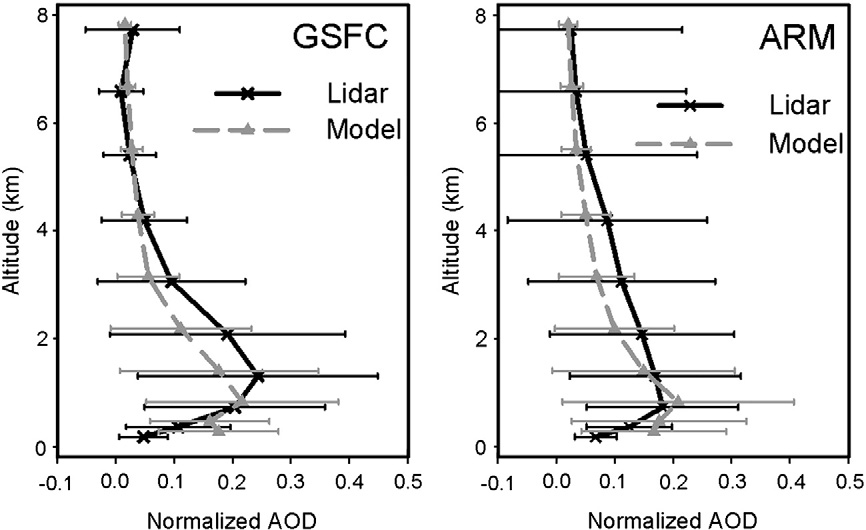
Example: Comparisons between the mean normalized aerosol profiles of lidars and GEOS-Chem at the GSFC site (left) and the ARM site (right). Lidar profiles are shown as black solid lines, GEOS-Chem profiles are shown as gray dashed lines. Horizontal error bars at each latitude are one standard deviation of daily normalized AOD values (Liu et al. RSE, 2011).

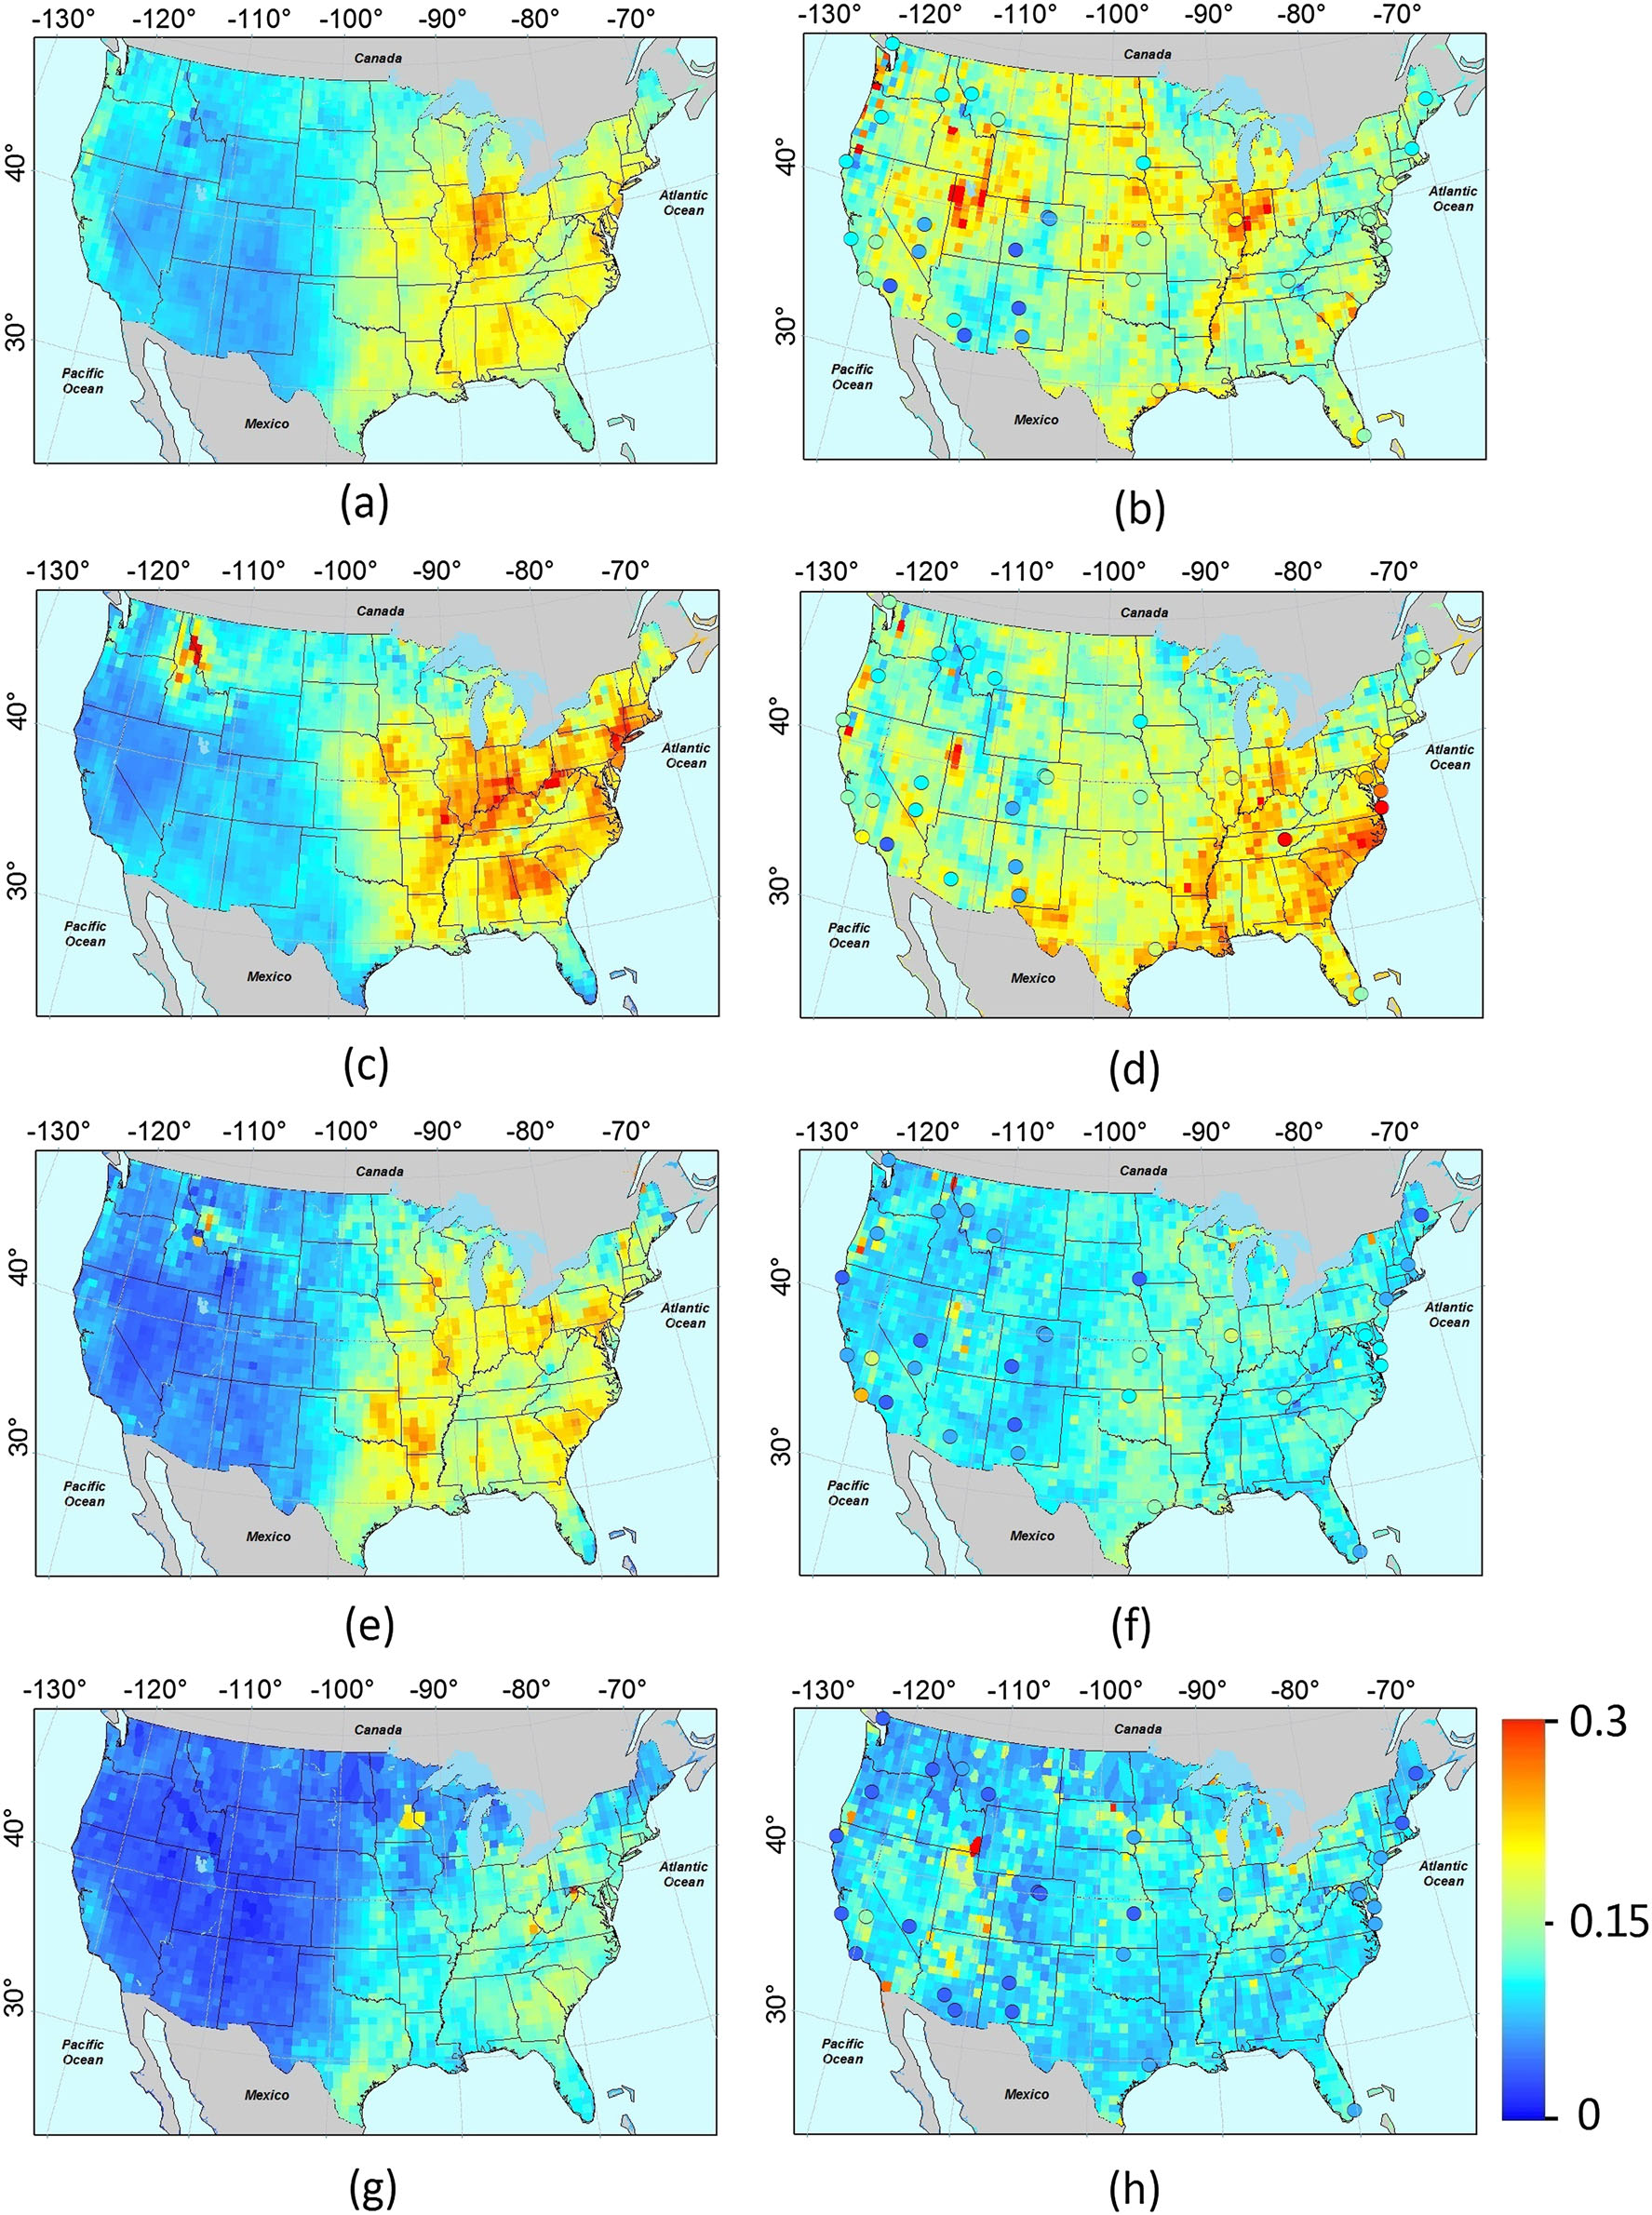
Example: Distributions of seasonal average AOD at 550 nm from 2008 to 2010 in (a, b) spring, (c, d) summer, (e, f) fall, and (g, h) winter. (left column) GC simulations are temporally and spatially matched with (right column) MISR cloud-free conditions. AERONET AOD distributions are superposed on the MISR maps (Li et al. JGR-Atmos, 2013).
